
Materials
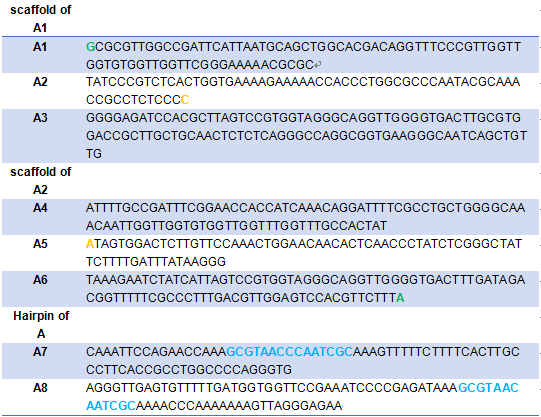
Green:Modified with Cy3
Yellow:Modified with Cy5
Blue:The hairpin of tweezers A
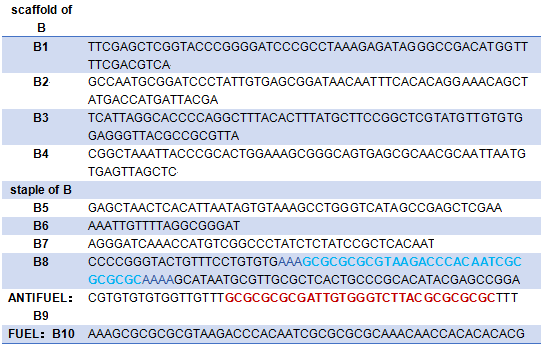
Blue:The hairpin of B8
Red:The complementary sequence of the hairpin
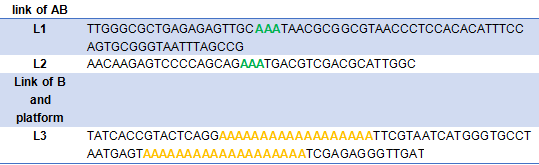
Green:The link between of tweezers A and tweezer B
Yellow:The link between tweezer B and the platform
10× TE buffer; 50× TAE buffer; IPTG; X-Gal; 1.5% agarose gel; fibrinogen; LB medium; 10× folding buffer; 10× PBS; 1×TAE-Mg2+ buffer; E.Z.N.A.® M13 DNA Mini Kit; bovine thrombin (0.5U/μL).
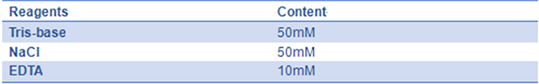
- 1) 10× TE buffer:100 mL 1 M Tris-HCl (pH 7.5 or 8.0) and 20 mL 0.5M EDTA (pH=8.0), then, add ddH2O to 1 L.
- 2) 50 x TAE buffer: 242 g Tris-base, 57.1 mL Acetate (100% acetic acid) and 100 mL 0.5 M sodium EDTA, then add ddH2O up to 1 L.
- 3) IPTG:Dissolve 238 mg IPTG (sigma I-6758) in 10 mL deionized water, store at -20°C.
- 4) X-Gal(20mg/ml): Dissolve 2 g X-Gal in 100 mL DMF, store at -20℃.
- 5) 1.5% agarose gel:Dissolve 0.3 g agarose in 20 mL 1× TAE buffer, heat the solution till agarose is completely dissolved, then add 20 μL Ethidium bromide (V(EB):V(TAE)=1:1000) into the TAE buffer when it cools down around 60°C.
- 6) Fibrinogen solution: Dissolve 6.2 mg fibrinogen in 1 mL 0.9% NaCl.
- 7) LB medium:
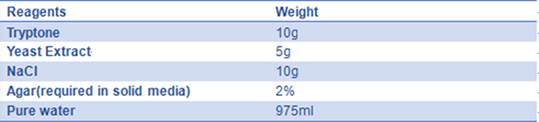
The solution is sterilized by autoclaving at 121°C for 20 minutes.
- 8) 10× folding buffer(pH=8.0):
- 9) 10× PBS(pH=7.4)::
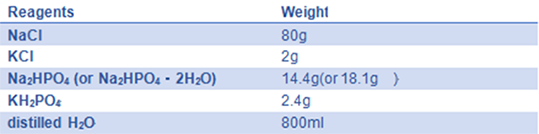
Adjust pH to 7.4 with HCl; add distilled H2O to 1 L; and autoclave for 20 minutes on liquid cycle, then store at RT
- 10) 1xTAE-Mg2+ buffer(pH=8.0): :
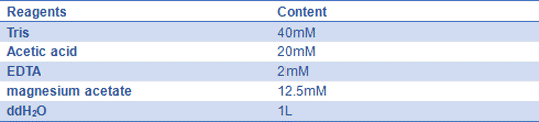
Mix reagents above, and store it at 4℃
- 11) E.Z.N.A.® M13 DNA Mini Kit:
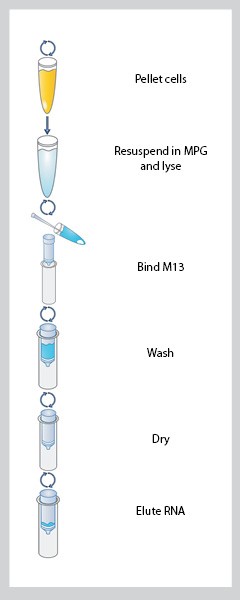
Figure 1. The instructions of E.Z.N.A.® M13 DNA Mini Kit
- 12) Omega Bio-tek’s E.Z.N.A.® M13 DNA Kits:It is designed to purify up to 10 μg of single-stranded DNA from up to 3 mL of phage supernatant. Yields of single-stranded DNA obtained using E.Z.N.A.® M13 DNA Kits are around 3-10 μg and reproducible when the isolations are performed from the same culture.

Protocols
Contents
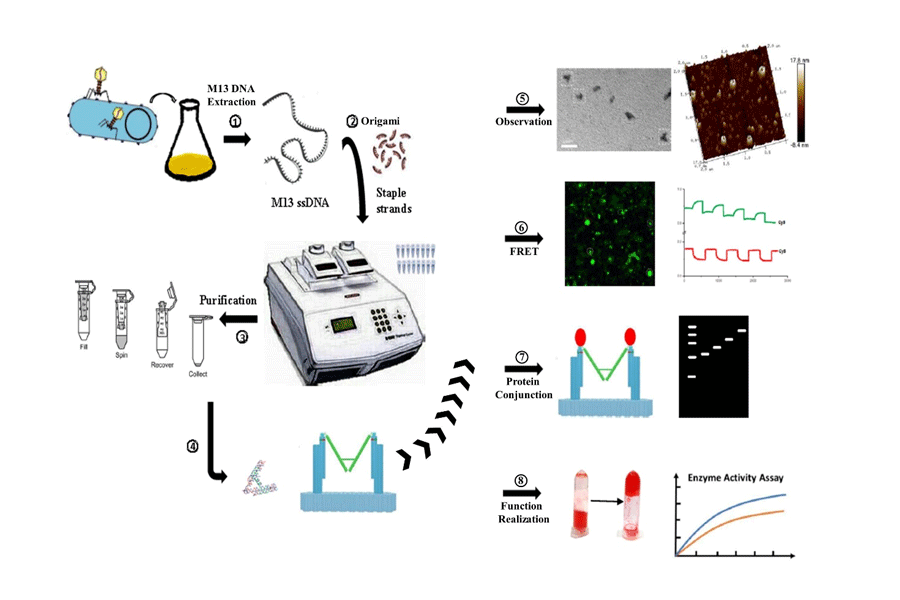
In this stage, we need to transfer the M13 bacteriophage RF dsDNA into JM109 Escherichia coli and incubate it to get more M13 bacteriophage. After that we have to concentrate and purify M13 DNA.
We transfer the M13 bacteriophage RF dsDNA into JM109 Escherichia coli, and incubate transferred E.coli on LB agar plates at 37℃ upside down for 12-16 hours.
We pick a blue single colony from LB agar plate. After the expanding culture of bacteriophage, we extract the nucleic acid by centrifugation at 6000 × g for 20 minutes.
We use E.Z.N.A.® M13 DNA Mini Kit to extract M13 ssDNA.
After we have got ssDNA, we measure the concentration by nucleic acid analyzer.
In this stage, to verify whether the ssDNA we have extracted from M13 phage is what we need, we sequence the ssDNA and transform the E. coli by ssDNA. The sequencing result and blue spot both confirm that we have got ssDNA. Finally we have got enough scaffold DNA, and we can start our DNA origami reaction. After a series of gradient experiments, we optimize the reaction condition.
Before we start to fold Nanofingers, we intend to fold the right structure of tweezer B to verify the feasibility of structure design at first.
1.3.1.1 a 50uL reaction system
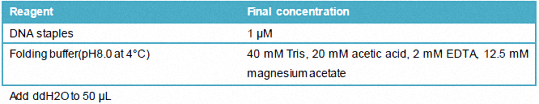
Add ddH2O to 50 μL
1.3.1.2 PCR procedure
Lid Control Mode: reheating at 100°C
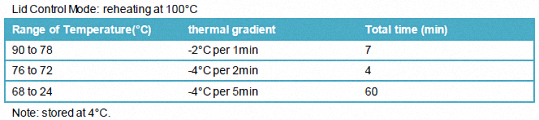
Note: stored at 4°C
1.3.2.1 a 50 μL reaction system
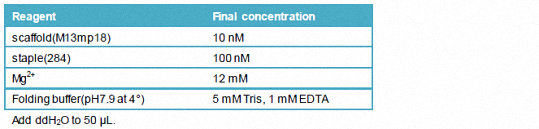
Add ddH2O to 50 μL.
1.3.2.2 PCR procedure
Lid Control Mode: reheating at 100°C
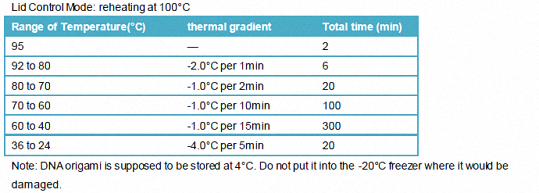
Note: DNA origami is supposed to be stored at 4°C. Do not put it into the -20°C freezer where it would be damaged.
To ensure successful folding, the staple strands are added in a 10-fold higher concentration than the scaffold. For purification of tweezer B or Nanofingers from the excess staple strands, a filtration step is carried out after folding. This is done by using Amicon Ultra-0.5 Centrifugal Filters for DNA purification and concentration with a pore size of 100 kD:
- Insert the Amicon Ultra-0.5 device into one of the provided microcentrifuge tubes.
- Add up to 100 μL of sample and 400μl pcr buffer with Mg2+ to the Amicon Ultra filter device.
- Spin the device at 4500 × g for 15 minutes and discard the liquid in the microcentrifuge tube.
- Repeat steps 2 and 3 for 4 times.
- Place the filter device upside down in the microcentrifuge tubes, spin for 4 minutes at 1000 x g to transfer the concentrated sample from the ultra filter device to the tube.
1.3.4.1 TEM imaging
We use to Transmission Electron Microscopy (TEM) to image the DNA origami structures (tweezer B). In this part, an additional DNA staining step is included, using a 2% uranyl acetate solution.
- The plasma cleaned grids are clamped on with tweezers.
- 5 µL of sample is applied on each grid and then incubated for 5-10 minutes.
- The liquid is then removed from the grid using a filter paper.
- For highly concentrated samples: an additional washing step is included using 5 μL of ultrapure water.
- For samples containing DNA: 4 µl of 2% uranyl acetate is applied and directly removed using a filter paper. Afterwards a second drop (4 µl) of uranyl acetate was applied and let stay on the grid for 10 seconds before removing it again.
- The grids are dried for 20-30 minutes before they are stored in a grid sample holder.
1.3.4.2 AFM imaging
The observation of the structure of Nanofingers we used is atomic force microscopy (AFM). We decide to adopt coverslip as the sample preparation and tapping mode in fluid to observe the structure of Nanofingers and the coverslip surface has to be completely flat in order to achieve the best results.
- The coverslip is dipped in 0.1mg/mL poly-L-lysine (diluted with 1×PBS ) overnight and dried in air.
- Add 7 μL of sample to the surface and incubate for 10 mintues.
- After that, wash it with 100ul 1×TAE buffer twice and keep wet.
We monitor the real-time opening and closing of the tweezers by labeling the tweezer A arms with Cy3 and Cy5 fluorescent dyes, respectively. Cy3 exhibits lower fluorescence in the closed state since part of its energy transfers to Cy5, whereas Cy5 exhibites higher fluorescence under the same conditions. The gradual decrease in the intensity of Cy3 and Cy5 fluorescence observed over time can be attributed to photo bleaching.
Laser scanning confocal microscope(LSCM) is used to observe the real-time FRET.
- sample preparation
sample 1: the Nanofingers incubated for 4 hours at 37°C.
sample 2: Add fuel into the Nanofingers and incubate for 4h at 37°C;
The samples are prepared on standard microscope slides to check for correct fluorescence labeling. Then, the slide surface is coated with 0.1mg/mL poly-L-lysine (diluted with 1×PBS) which enables electrostatic binding of the negatively charged DNA as it creates a positively charged surface. The slide is dipped in the buffer overnight and dried in the air. 5 μL of specimen is directly deposited on the glass slide and incubated for 15 minutes at room temperature out of light and then covered with a piece of coverslip before mounting onto the sample stage. - fluorescence microscope observation
Fluorescence imaging is carried out on an LSCM in the sequential line mode and pictures are taken in a final imaging magnification of 100 fold. The donor dye Cy3 on Nanofingers is excited using the 550-nm laser. The resulting fluorescence, Cy3’s and acceptor dye Cy5’s emitted light, is recorded in two independent channels set up to detect emitted spectra correspondingly in the ranges 570-625 nm(for Cy3) and 655-755 nm(for Cy5). By this sequentially scanning the specimen with the individual laser(550 nm) and detecting fluorescence in two channels, Cy3’s and Cy5’s emitted light can be clearly exhibited on images which shows us whether FRET occurs. Images in each group are captured in the same region in two channels respectively. The laser beam alignment and imaging process are automatically controlled by the software.
We also conduct the FRET-experiment in a Hitachi F4500 fluorescence spectrophotometer using a quartz cuvette at room temperature about 20ºC. The concentration of Nanofingers is 20 nM. Donor (Cy3) fluorescence is excited by illumination at 550 nm, and donor emission is measured at 565 nm. Acceptor (Cy5) is excited at 646nm, and acceptor emission is measured at 664 nm. Both the excitation slit and emission slit are 5 nm, and is measured at time scanning mode. After each addition of fuel or antifuel, the sample is mixed by rapid pipetting for about 30s. During this time, the fluorescence signal is collected continuously by the instrument, but in fact there is no signal because of the right-angled optical path. So we omit the data (all zero) during these periods. Each addition of fuel or antifuel represent a 20% stoichiometric excess over the previous addition.
The Nanofingerss and thrombin are mixed at different concentrations and incubated for 2 hours at 25°C before gel electrophoresis. The concentration of Nanofingerss is set at 20 nM and the concentration of thrombin is set as the ration 1:0, 1:2, 1:5, 1:10 and 1:20. Nanofingers loaded in each lane is at equal amount. The gel containing 1.5% agarose and 0.1% ethidium bromide runs for 40 minutes at constant 80 V and is observed under UV.
In this stage, The Nanofingers and thrombin are mixed of the concentration at 1:1 and incubated for 2 hours at 37°C.
We take the clotting time in fibrinogen test as the qualitative analysis. Add 0.6 μL of the mixture to 300 μL of the bovine Fibrinogen with red ink in a 2 mL centrifuge tube. Place a sampe in 37°C water bath at 1 minute interval, totally 9 samples. After that, take out and invert the tubes on a flat. In this way, we can count the number of tubes in which the reactant don’t fall down.
We measure the enzymatic activity in Multimode Reader as the quantitative analysis. Add 0.4 μL of Nanofingers with thrombin into 200 μL bovine Fibrinogen in 96-well plates. We spot three samples in control group and experiment group respectively to eliminate errors. During the measurement, the working wavelength is 480 nm. The incubation time is 30 seconds, so is the testing time. The measurement stops while the absorbance value remains unchanged.
References
[1] Minghui Liu, Jinglin Fu, A DNA tweezer-actuated enzyme nanoreactor. Nature communications. DOI: 10.1038/ncomms3127 (2013)
[2] Chao Zhou, Zhongqiang Yang, and Dongsheng Liu, Reversible Regulation of Protein Binding Affinity by a Nanofingers. American Chemical Society. 134, 1416-1418(2012)
[3] Roger L. Lundblad. A Rapid Method for the Purification of Bovine Thrombin and the Inhibition of the Purified Enzyme with Phenylmethylsulfonyl Fluoride". Biochemistry, VOL.10, NO. 13(1971)
[4] Jean-Philippe J. Sobczak, Rapid Folding of DNA into Nanoscale Shapes at Constant Temperature.Science.VOL338 (2012)
[5] Chenxiang Lin1, Ralf Jungmann. Submicrometre geometrically encoded fluorescent barcodes self-assembled from DNA. Nature Chemistry. DOI: 10.1038 (2012)