
Structure
Contents
A tweezer B serves as a trigger to actuate Nanofingers to change its form between open and closed state. By optimizing the folding conditions, we successfully fabricate tweezer B initially with an open form. Folding of the tweezer B is carried out by applying a thermal ramp for about 1 hour. To characterize the folding outcome, TEM imaging is performed to observe the folding structure.
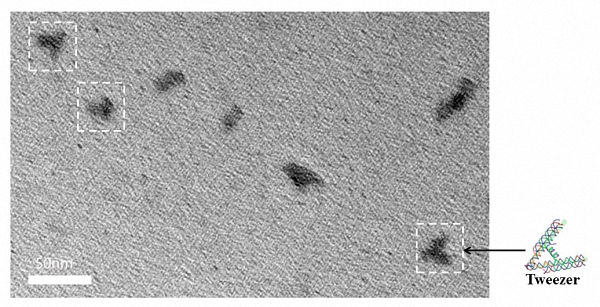
Figure 1. TEM image of tweezer B
The switch of tweezer B from open conformation to closed conformation is achieved by introducing the fuel strand to the system. Based on a strand-displacement reaction, a fuel strand releases the antifuel that is partially complementary to the hairpin, resulting in a form switch to the closed conformation. The difference between these two conformations are indicated by the speed of migration in agarose gel electrophoresis, in which 3% agarose gels containing 0.1% ethidium bromide prepared at room temperature runs for 30 minutes at constant 100V and then is observed under UV.
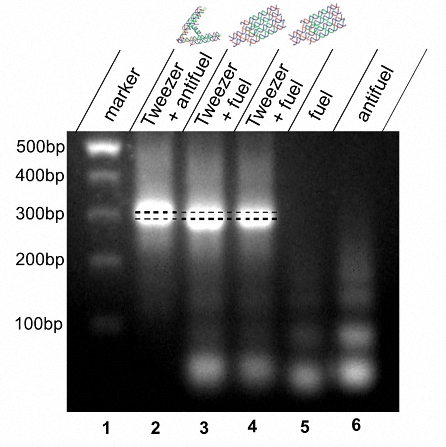
Figure 2. Lane 1: DNA marker. Lane 2: tweezer B in open form. Lane 3: tweezer B incubated at 37℃ for 12 hours after adding fuel. Lane 4: tweezer B incubated at 42℃ for 3 hours and cooling to 37℃, then incubated at 37℃ for 6 hours. Lane 5: fuel strands only. Lane 6: antifuel strands only.
The results are shown is Figure 2, which proves the oriented conformational change of tweezer B of which the size is about 300bp. The close of tweezer B gives it a more compacted structure which accounts for the faster migration speed in the electrical field. Therefore, we can conclude that the fuel strands successfully remove the antifuel strands with a strand-displacement reaction and change the form of tweezer B from open to closed. Different temperature (37℃ and 42℃) is adopted to find an optimizing condition for strand-displacement (lane 3 and lane 4) and the image shows that the reaction can proceed without obvious difference in efficiency.
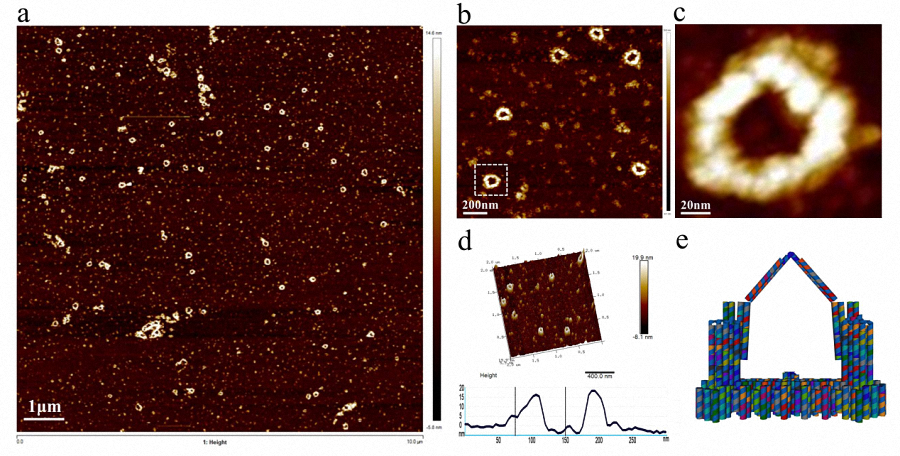
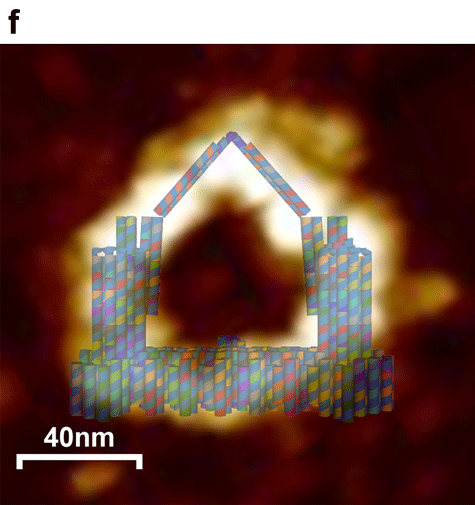
Figure 3. AFM and model images of Nanofingers. a , b) Wide field image of successfully assembled Nanofingers with a high yield. c) A magnified image of Nanofingers framed with white line in image b. d) Height profile, curve between the vertical line indicates the height of Nanofingers framed in image b. e) A model image corresponding to the real structure illustrated in image c to give a vivid cognition of the successfully assembled Nanofingers. f) The merged image of the AFM image and the designed model.
The intact structure of Nanofingers is successfully folded after the origami experiment. Followed with a purification and concentration, we can finally see Nanofingers under AFM with a high yield. A magnified image of Nanofingers shown in figure 3c is corresponded to the model image in figure 3e, so that we can have a clearer understanding of its structure. In figure 3d, a height profile is given suggesting that Nanofingers measures about 15 nm in height, approaching our design 13nm, which confirms the successful folding. However, it is noticeable that the position of tweezer B (middle tweezer) differs from what we have designed in cadnano. It turns over outward the platform accounting for the low binding efficiency of the linker strand between the platform and the bottom of tweezer B. Yet it doesn’t affect the function of the whole device which can also be proved by the following experimental results.
We characterize the conformational change of Nanofingers using FRET between Cy3/Cy5 dye pairs.
By sequentially scanning the specimen with a fixed excitation wavelength (550nm, excitation wavelength for Cy3) and detecting the fluorescence in two channels, the emitted light of Cy3 and Cy5 can be clearly exhibited on images, showing us whether FRET occurs. When FRET occurs, Cy5 is excited showing a red color while sometimes there may exists a very weak green light probably caused by spectral bleed-through. In comparison, when FRET doesn’t occur, the emission light of Cy3 and Cy5 can both be detected at the same point and we can see yellow overlap spots in the merged image. We number yellow spots in FRET image and non-FRET image and give an evaluation on the difference between the two different status.

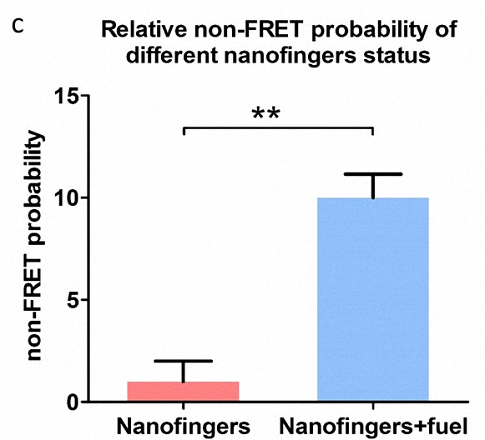
Figure 4. a) Two different conformation of Nanofingers, corresponding to FRET status(top) and non-FRET status(bottom) respectively. b) Images taken by LSCM. The top three images are taken from the same sample with FRET effect while the three images in the bottom are taken from the sample without FRET effect. The yellow spots (non-FRET Nanofingers) are marked and numbered in the image. c) Histogram displaying the relative non-FRET probability of different Nanofingers status.
As shown in Figure 4b, in the three images (top) of the first sample, red light takes advantage over green light and only one yellow spot is collected in the field of view, demonstrating high efficient FRET of Nanofingers. In contrast, when the second sample is observed, red light declines while green light is enhanced, resulting in the significant increase in the yellow spots (10 yellow spots). As shown in Figure 4c, we achieve the highly significance difference (marked on “**”) between these two samples by analysis of data with histogram. Therefore, we can draw a conclusion that an efficient conformational change takes place in Nanofingers by adding fuel strands.
We also demonstrate the FRET effect by measuring the fluorescent intensity changes of Cy3 and Cy5. Initially, tweezer B on the assembled Nanofingers is open and the two tweezers A are closed, which exhibits a lower Cy3 signal and a higher Cy5 signal due to FRET effect. When fuel strand is added, antifuel strand is removed from the hairpin inside tweezer B, making it change to its closed conformation. Through linking strands, tweezers A are dragged open motivated by tweezer B. In this state, the distance between Cy3 and Cy5 is too large for efficient FRET, resulting in a decrease in fluorescent intensity for Cy5 and an increase for Cy3.
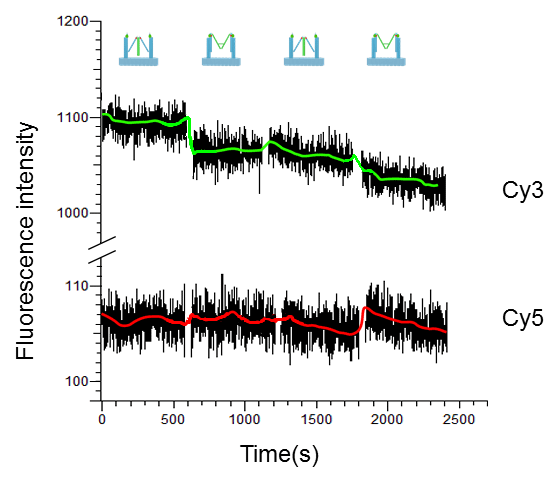
Figure 5. FRET measurement of the DNA machine upon successive addition of fuel and antifuel strands.
Depicted in Figure 5, by adding the fuel, FRET-state Nanofingers switches to non-FRET state, causing an increase in Cy3 signal and slight decrease in Cy5 signal. Removing the fuel strands by addition of the antifuel strands drives Nanofingers back to the initial state, resulting in the decrease in Cy3 signal and slight increase in Cy5 signal. This cycle is repeated twice. During the whole process, the fluorescent intensity decays gradually due to photo bleaching. When measuring Cy5 signal, the high concentration of fuel and antifuel strands significantly affects the detection, resulting in a loud noise in the system and slight change in Cy5 signal.

Function
Contents
Thrombin catalyzes the transformation of fibrinogen into a product which can undergo a series of aggregation reactions. While this catalysis may be inhibited if thrombin is combined with a specific aptamer, and this theory is used in our experiment.
A rough estimate of the binding ability of Nanofingers to thrombin is obtained by a series of gradient tests of the thrombin concentration. Nanofingers and thrombin are mixed at different concentrations and incubated for 2 hours at 25°C before gel electrophoresis. The concentration of Nanofingers is set at 20 nM and thrombin at several gradients shown in figure 6.
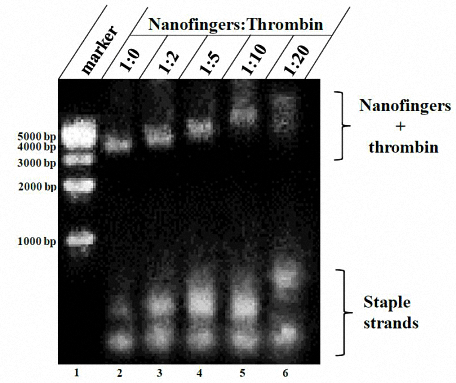
Figure 6. Gradient test to estimate the binding ability of Nanofingers to thrombin.
Since the lane 1 contains Nanofingers only, it migrates fastest. When thrombin combines with Nanofingers which is equipped with aptamers, the mobility of the whole structure slows down. Furthermore, the higher the concentration of thrombin, the lower the mobility is. The result is supposed to be caused by different degrees of binding affinity. In addition, it is noticeable that the band in lane 6 smears, which is induced by nonspecific binding.
To visualize prothrombin time test, we add drops of red ink into the bovine fibrinogen solution. We devised two groups, one contains thrombin and Nanofingers (experimental group), and the other one only contains thrombin (control group). Tubes of each group are put into water bath at 37℃ one by one at one minute interval, altogether 8 minutes and then incubated for another 1 minute. 9 tubes are used in each group. The tubes are placed upside down. The uncoagulated solution is supposed to flow down, while this phenomenon doesn’t occur if the solution is coagulated.
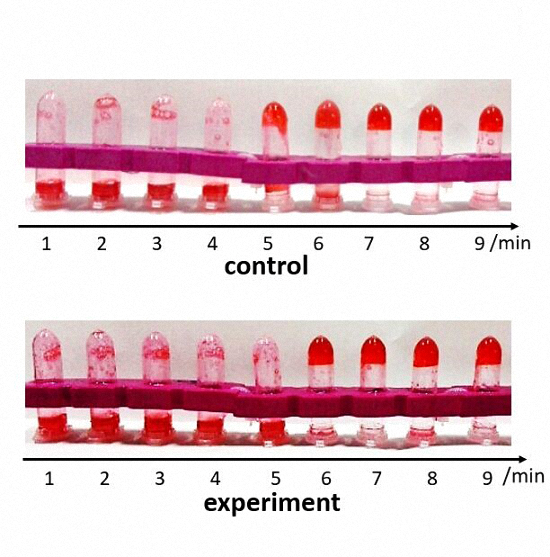
Figure 7. Control: 300 ul bovine fibrinogen with red ink. Experiment: 0.6 ul thrombin combining with DNA machine
In the control group, the solution is coagulated in 5 minutes while the clotting time is extended for 1 minute in the experimental group. We obtain similar results by means of several repeated experiments. So we conclude that when Nanofingers captures thrombin, it can effectively restrain its activity which is the basis of the function realization of Nanofingers.
Although PT test has preliminary proved that our Nanofingers can reduce the activity of thrombin, we intend to have a more specific enzyme activity detection. Due to the existence of thrombin, fibrinogen is transformed into fibrous protein which polymerizes in a short time. As a result, the reaction system turns into a colloidal state in which the intensity of scattered light will increase according to Rayleigh scattering. So we monitor the intensity of scattered light at 480 nm to detect the enzymatic activity.
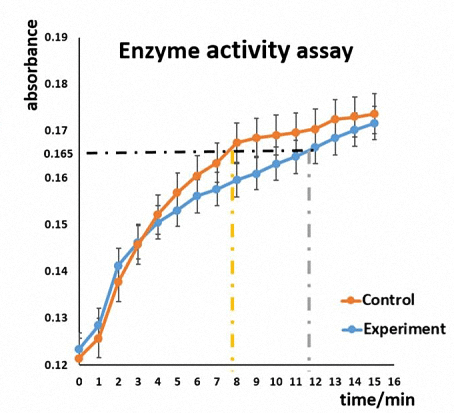
Figure 8. Enzyme activity assay to detect whether the activity of thrombin will be affected due to the combination with Nanofingers. Control group contains only thrombin while experimental group contains thrombin and Nanofingers.
The graph shows that the red curve is mainly above the blue one, indicating that the enzyme activity of thrombin is restrained because of the involvement of Nanofingers. Additionally, it costs about 8 minutes when the absorbance value is up to 0.165 in control group, while 12 minutes are needed for experimental group, which proves that the activity of thrombin is inhibited due to the combination with Nanofingers.